I Added Concurrency… and My Program Got Slower
Concurrency is often the first tool engineers reach for when trying to make a program faster. If a task can be split into independent units of work, running them in parallel seems like the obvious optimization.
But adding more workers does not always mean better performance. At some point, the gains stop. Sometimes the program even gets slower.
I ran a small experiment to understand why. This is what I found.
Experiment 1: Saturating the CPU
Setup
The setup is simple. Pick a task that is purely computational, has no I/O, and can be split into independent units of work.
Prime checking fits this requirement, where, for each number in a range, we determine whether it is prime. Each check is independent and stateless, which makes it trivial to distribute across workers.
Here's the core logic of this experiment :
func isPrime(n int) bool {
    if n < 2 {
        return false
    }
    for i := 2; i*i <= n; i++ {
        if n%i == 0 {
            return false
        }
    }
    return true
}
To make the prime check concurrent, the program uses a worker pool. A channel is loaded with every number in the range. Each worker goroutine pulls from that channel, runs isPrime, and loops until there is nothing left.
The main goroutine launches all workers simultaneously and blocks until the last one finishes. That window, from launch to completion, is the measured time.
The range is set to one million numbers. Worker counts are 1, 2, 4, 8, 16 and 32. Each configuration runs independently and the elapsed time is recorded for each.
The final program looks like this :
package main

import (
	"fmt"
	"sync"
	"time"
)

// isPrime checks if a number is prime using trial division up to sqrt(n).
// Intentionally not optimized to keep the CPU busy on each number.
func isPrime(n int) bool {
	if n < 2 {
		return false
	}
	for i := 2; i*i <= n; i++ {
		if n%i == 0 {
			return false
		}
	}
	return true
}

// Each worker pulls numbers from the jobs channel and runs the primality check.
// Workers stop when the channel is closed and drained.
func worker(jobs <-chan int, wg *sync.WaitGroup) {
	defer wg.Done()
	for n := range jobs {
		isPrime(n)
	}
}

func run(workerCount, rangeEnd int) time.Duration {
	// Buffered channel to allow the producer to stay ahead of workers.
	jobs := make(chan int, 1000)

	var wg sync.WaitGroup
	start := time.Now()

	// Producer: feeds numbers into the channel lazily.
	// Lazy feeding avoids allocating the entire range upfront in memory.
	go func() {
		for i := 2; i <= rangeEnd; i++ {
			jobs <- i
		}
		close(jobs)
	}()

	// Launch all workers simultaneously.
	// Each worker competes to pull the next number from the shared channel.
	for i := 0; i < workerCount; i++ {
		wg.Add(1)
		go worker(jobs, &wg)
	}

	// Wait for all workers to finish before stopping the clock.
	wg.Wait()
	return time.Since(start)
}

func main() {
	const rangeEnd = 5_000_000
	workerCounts := []int{1, 2, 4, 8, 16, 32}

	fmt.Println("workers | time")
	fmt.Println("--------|------")

	// Run the experiment for each worker count and print elapsed time.
	for _, w := range workerCounts {
		duration := run(w, rangeEnd)
		fmt.Printf("%7d | %s\n", w, duration)
	}
}
Before looking at the numbers, consider what you would expect. More workers means more cores utilized, so runtime should keep dropping as worker count increases. Does it?
Results
NOTE: This experiment was run on a MacBook Air M3 with 8 CPU cores.
Running the program across worker counts of 1, 2, 4, 8, 16, and 32 produces the following :
$ go run main.go

workers | time
--------|------
      1 | 691.470584ms
      2 | 543.914542ms
      4 | 516.159958ms
      8 | 496.33ms
     16 | 510.741959ms
     32 | 557.69275ms
Plotting these results on Desmos with worker count on the x-axis and execution time in milliseconds on the y-axis gives the following points:
(1, 691)
(2, 543)
(4, 516)
(8, 496)
(16, 510)
(32, 557)
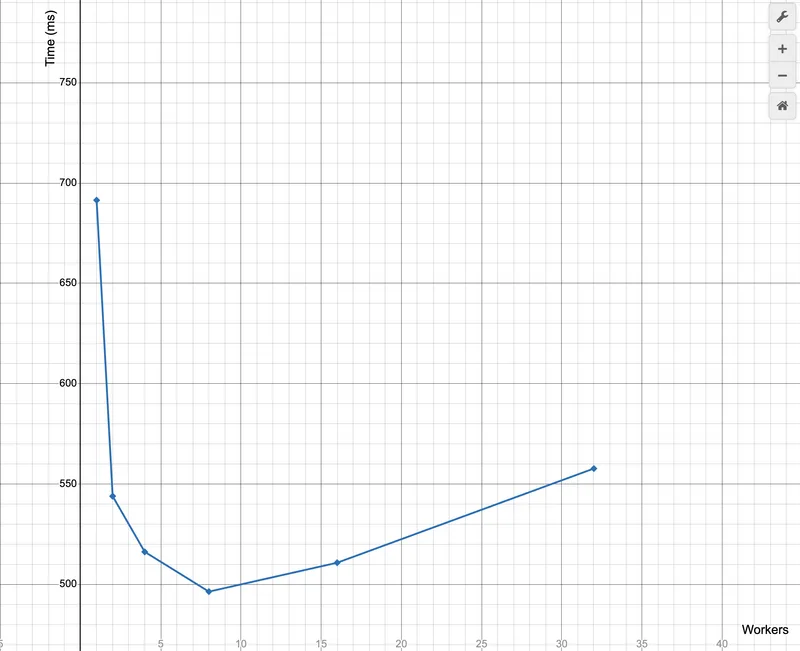
The curve drops sharply from 1 to 2 workers, tapers between 2 and 8, flattens around 8, and then climbs back up at 16 and 32. That shape is the experiment. The left side of the curve is where concurrency is doing useful work. Each additional worker is picking up load that was previously sitting on a single core. The right side is where the system has run out of something to give.
Learnings
The M3 has 8 performance cores. Once all 8 are fully occupied, there is no additional compute capacity to allocate. Extra goroutines queue for core time rather than running in parallel. The scheduler context switches between them and that overhead shows up directly in wall-clock time.
At 32 workers the machine is running four goroutines per core. CPU cycles are being spent on scheduling, not on isPrime. That is the cost visible in the uptick at 16 and 32.
There is a secondary bottleneck worth calling out. Every worker in this program pulls jobs from a single shared channel. In Go, channel access is serialized under the hood using a mutex. Only one goroutine can send or receive at a time. At low worker counts this is not a problem because the channel is rarely contested.
However, At 16 or 32 workers, every goroutine is racing to pull the next number from the same queue. Most of them lose and have to park and wait. That waiting is serialization, and serialization kills parallelism. The workers are not blocked on CPU work at this point, they are blocked on each other. This is why the curve starts bending earlier than the core count alone would predict.
For CPU-bound workloads, the hard ceiling is core count. Past that, concurrency becomes overhead.
Experiment 2: Saturating the Disk
Setup
This time the workload is I/O bound. The program reads a large file from disk and measures how long the full read takes as the number of workers increases.
The file used in the experiment is 2.3 GB (large.txt). It was generated with the yes command, which produces a continuous stream of y characters separated by newlines.
The reading strategy is straightforward. The file is opened once to determine its size and then closed. The total size is divided into equal byte ranges, one per worker.
Each worker then opens its own file descriptor, seeks directly to its assigned starting offset, and reads only its portion of the file in 4096-byte chunks. The final worker absorbs any remainder from integer division.
There is no shared state and no coordination between workers. The program simply issues concurrent reads against different regions of the same file and measures how the total runtime changes as concurrency increases.
package main

import (
	"fmt"
	"io"
	"os"
	"sync"
	"time"
)

func worker(filePath string, start int64, length int64, wg *sync.WaitGroup) {
	defer wg.Done() // signal completion to the WaitGroup

	// Each worker opens its own file descriptor so it can read independently
	file, err := os.Open(filePath)
	if err != nil {
		panic(err)
	}
	defer file.Close()

	// Move the file cursor to the starting offset assigned to this worker
	_, err = file.Seek(start, io.SeekStart)
	if err != nil {
		panic(err)
	}

	// Buffer used for chunked reads
	buf := make([]byte, 4096)

	bytesRead := int64(0)

	// Continue reading until this worker has consumed its assigned range
	for bytesRead < length {
		remaining := length - bytesRead

		// Do not read past the assigned chunk
		readSize := int64(len(buf))
		if readSize > remaining {
			readSize = remaining
		}

		// Read the next portion of the file
		n, err := file.Read(buf[:readSize])
		bytesRead += int64(n)

		if err == io.EOF {
			break
		}
		if err != nil {
			panic(err)
		}
	}
}

func run(filePath string, workerCount int) time.Duration {
	// open the file once to determine its size
	file, err := os.Open(filePath)
	if err != nil {
		panic(err)
	}

	info, err := file.Stat()
	if err != nil {
		panic(err)
	}
	file.Close()

	fileSize := info.Size()
	chunkSize := fileSize / int64(workerCount) // divide file into equal regions

	var wg sync.WaitGroup
	start := time.Now() // start measuring execution time

	for i := 0; i < workerCount; i++ {
		startOffset := int64(i) * chunkSize
		length := chunkSize

		// last worker consumes any remaining bytes
		if i == workerCount-1 {
			length = fileSize - startOffset
		}

		wg.Add(1)
		go worker(filePath, startOffset, length, &wg) // launch concurrent reader
	}

	wg.Wait() // wait for all workers to finish
	return time.Since(start)
}

func main() {
	const filePath = "large.txt"
	workerCounts := []int{1, 2, 4, 8, 16, 32} // different concurrency levels

	fmt.Println("workers | time")
	fmt.Println("--------|------")

	for _, w := range workerCounts {
		// run the experiment with different worker counts
		fmt.Printf("%7d | %s\n", w, run(filePath, w))
	}
}
The same question applies here. If the disk can be read faster by throwing more concurrent readers at it, runtime should keep falling as worker count climbs. Does it?
Results
NOTE: This experiment was run on a MacBook Air M3 with an NVMe SSD.
Running the program across worker counts of 1, 2, 4, 8, 16, and 32 produces the following:
$ go run main.go

workers | time
--------|------
      1 | 1.076674833s
      2 | 291.76025ms
      4 | 217.505292ms
      8 | 419.686125ms
     16 | 421.185208ms
     32 | 422.706041ms
Plotting these results on Desmos with worker count on the x-axis and execution time in seconds on the y-axis:
(1, 1.0767)
(2, 0.2918)
(4, 0.2175)
(8, 0.4197)
(16, 0.4212)
(32, 0.4227)
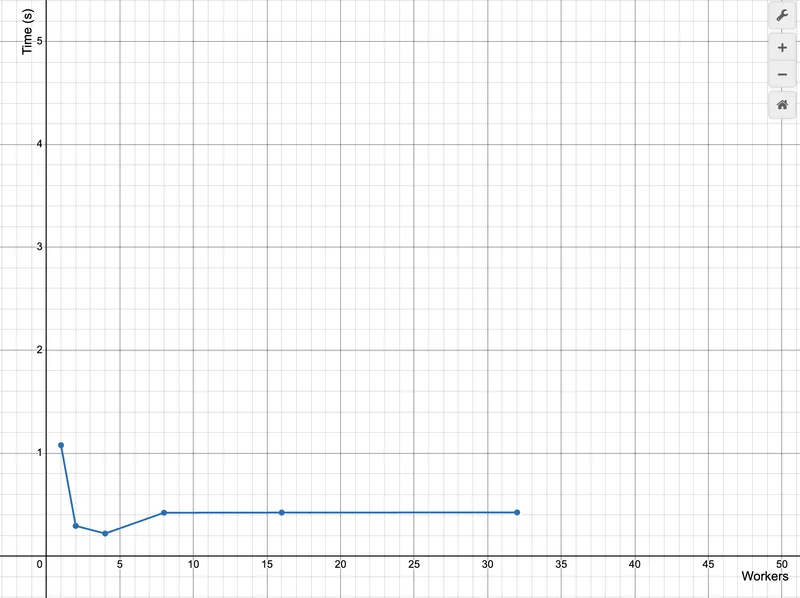
The curve shows three phases. From 1 to 4 workers runtime drops sharply as multiple goroutines increase the IO queue depth and the NVMe controller can serve several reads in parallel. Around 4 workers the curve bottoms out, indicating the SSD is close to its effective read throughput. Beyond this point the trend reverses. Additional workers only compete for the same bandwidth, increasing syscall overhead and IO queue contention. By 8 workers and above the storage subsystem is saturated, so more concurrency simply adds coordination overhead rather than improving throughput.
Learnings
The M3 uses an NVMe SSD. Unlike older drives, NVMe devices are designed to handle a small amount of parallel IO. The controller has multiple internal channels and can service several read requests at once. That is why performance improves when moving from one worker to a few workers. Increasing the queue depth allows the controller to utilize that internal parallelism.
However, that parallel window is limited. Once the controller and storage channels are saturated, additional workers only add more requests to the queue. The disk is no longer reading data faster; it is simply managing more competing requests. Throughput stops improving and latency begins to rise.
On an HDD the situation is far worse. A hard disk has a single mechanical read head that must physically move across spinning platters to reach data. Concurrent readers force that head to constantly reposition between different regions of the disk. Instead of streaming data sequentially, the drive spends time seeking between tracks, and performance degrades almost immediately.
The underlying constraint is the same in both cases. Storage has a fixed throughput ceiling. Concurrency can help reach it, but it cannot push it higher. Beyond that point, more workers only introduce contention.
Takeaways
Both experiments follow the same shape. Performance improves as workers increase, flattens at a threshold, then degrades.
The threshold is different in each case for
- core count for CPU work
- storage controller capacity for I/O
But the underlying principle is the same :
Every system has a bottleneck. Concurrency is useful up to that bottleneck and wasteful past it.
Hence, the question to ask before adding workers is "what resource does this work compete for, and how much of it is available."
More goroutines is not a performance strategy. Knowing your bottleneck is.